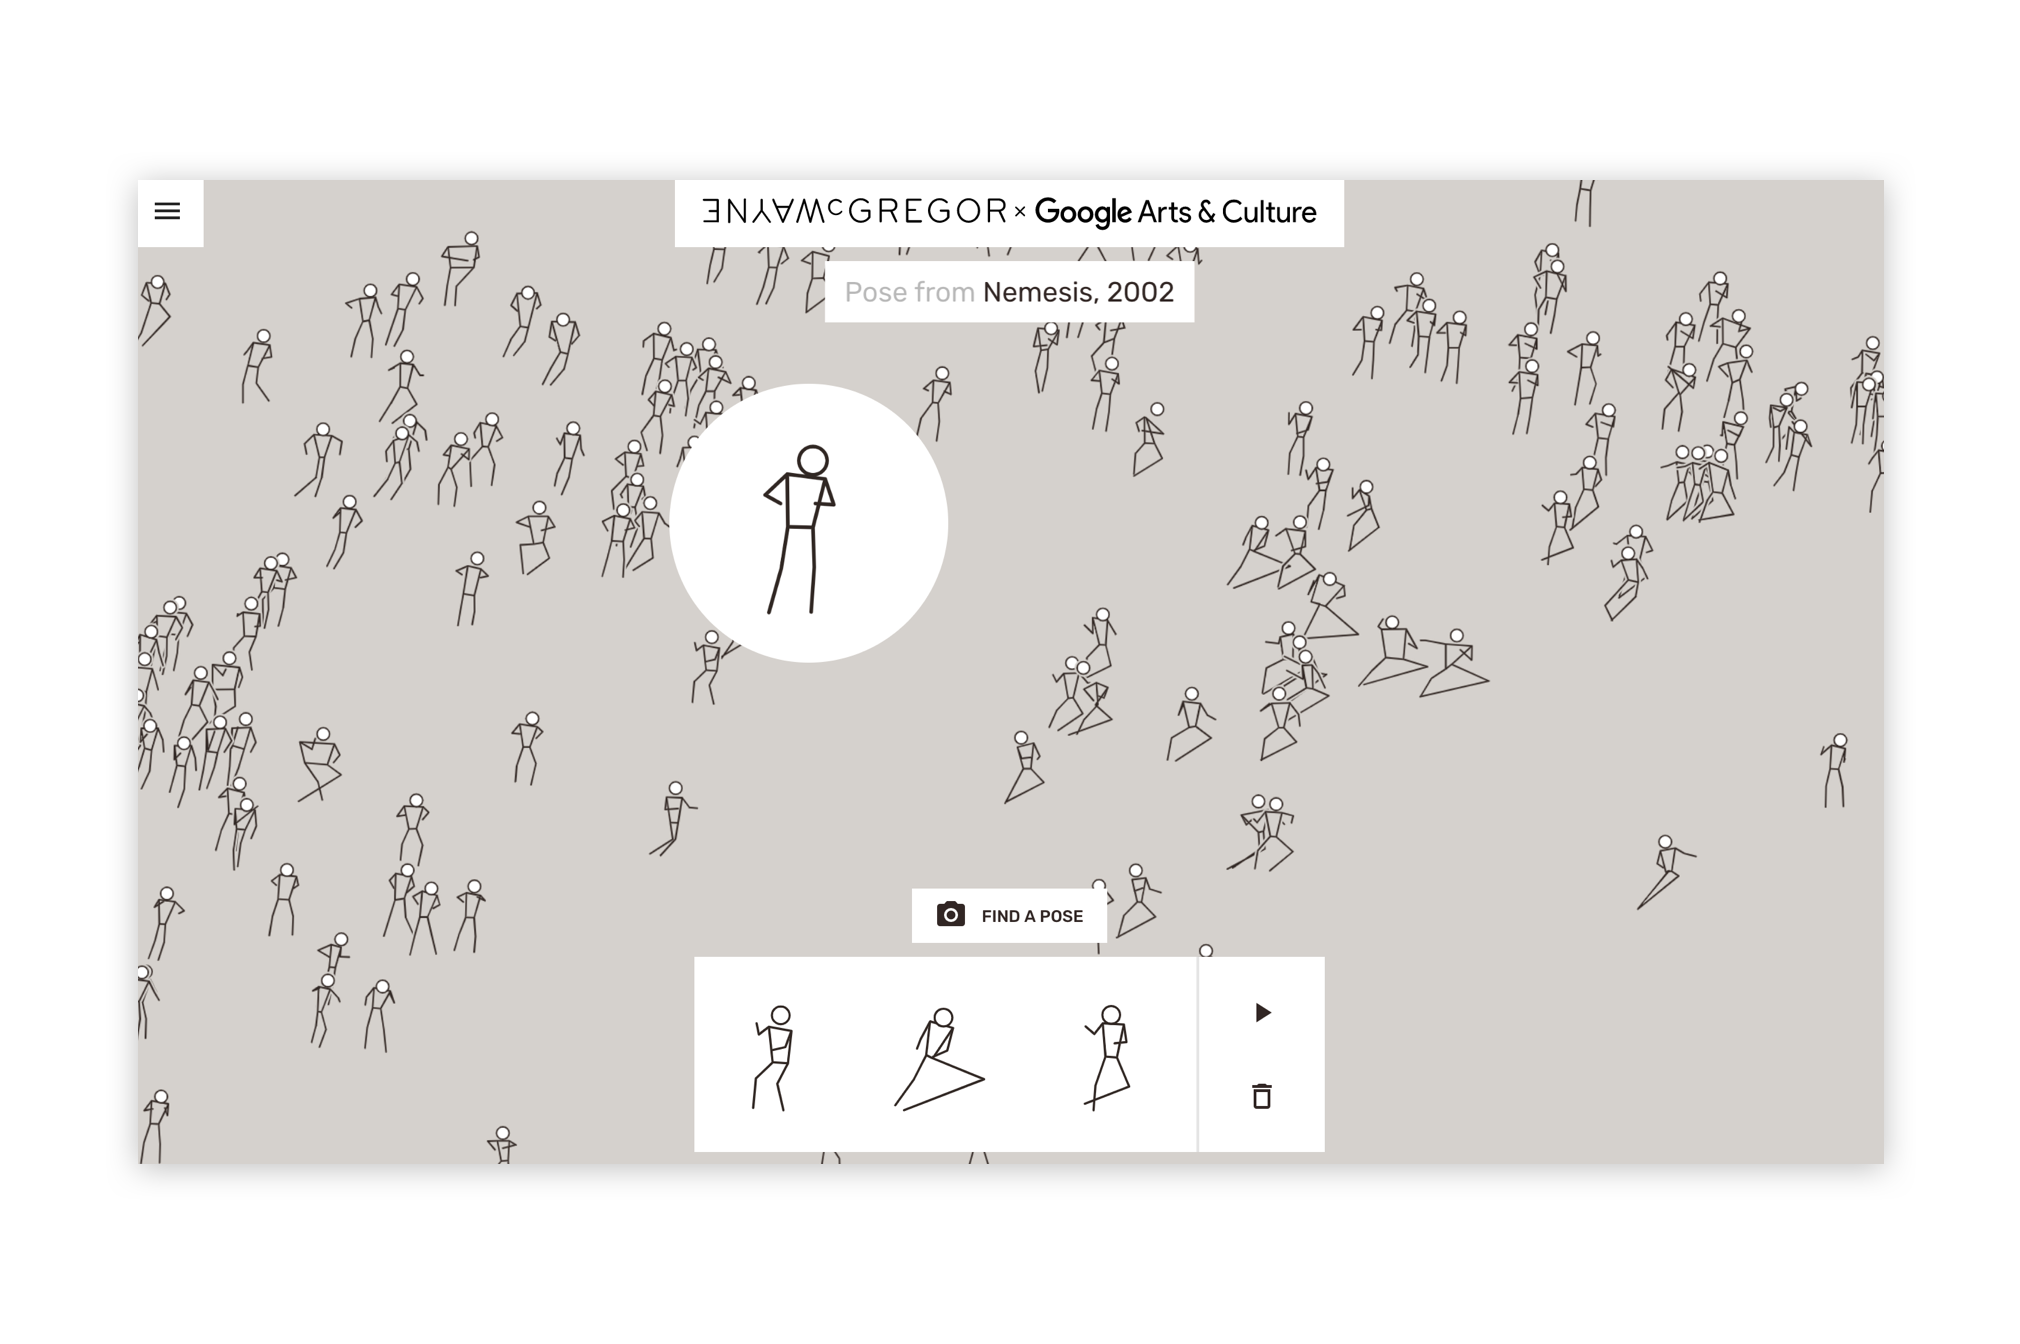
Problem:
The user wants to quickly understand the general shape of the dataset used by the system, the extent of it, and what patterns might exist within it.

Solution:
The system provides an attractive visualization that takes all the underlying data or a subset of it, and renders it into an easily comprehendible visual. This may be a static image or, if interactive, it may form part of a Dataset Explorer.
Discussion:
In general, users struggle to understand what it means when data powers a system, especially when the reality is that that data is just a list of abstract variables. Using a visualization to illustrate the nature of that data is an incredibly effective tool for helping users build a mental model of the system. In contrast to the Dataset Explorer pattern, where users want to understand and validate the data on a granular level, here even if that visualization is a big picture simplification or only portrays a small subset of data, it can still be a very valuable asset to share.